pygmt.Figure.grdcontour
- Figure.grdcontour(grid, projection=None, frame=False, region=None, verbose=False, panel=False, transparency=None, perspective=False, **kwargs)
Make contour map using a grid.
Takes a grid file name or an
xarray.DataArrayobject as input.Full GMT docs at https://docs.generic-mapping-tools.org/6.6/grdcontour.html.
Aliases:
A = annotation
C = levels
G = label_placement
L = limit
Q = cut
S = resample
W = pen
f = coltypes
l = label
B = frame
J = projection
R = region
V = verbose
c = panel
p = perspective
t = transparency
- Parameters:
grid (
str|PathLike|DataArray) –Name of the input grid file or the grid loaded as a
xarray.DataArrayobject.For reading a specific grid file format or applying basic data operations, see https://docs.generic-mapping-tools.org/6.6/gmt.html#grd-inout-full for the available modifiers.
levels (float, list, or str) –
Specify the contour lines to generate.
The file name of a CPT file where the color boundaries will be used as contour levels.
The file name of a 2 (or 3) column file containing the contour levels (col 0), (C)ontour or (A)nnotate (col 1), and optional angle (col 2).
A fixed contour interval.
A list of contour levels.
annotation (float, list, or str) –
Specify or disable annotated contour levels, modifies annotated contours specified in
levels.Specify a fixed annotation interval.
Specify a list of annotation levels.
Disable all annotations by setting
annotation="n".Adjust the appearance by appending different modifiers, e.g.,
"annot_int+f10p+gred"gives annotations with a font size of 10 points and a red filled box. For all available modifiers see https://docs.generic-mapping-tools.org/6.6/grdcontour.html#a.
limit (str or list of 2 ints) – low/high. Do no draw contours below low or above high, specify as string
cut (str or int) – Do not draw contours with less than cut number of points.
projection (
str|None, default:None) – projcode[projparams/]width|scale. Select map projection.region (str or list) – xmin/xmax/ymin/ymax[+r][+uunit]. Specify the region of interest.
frame (bool, str, or list) – Set map boundary frame and axes attributes.
label_placement (str) – [d|f|n|l|L|x|X]args. Control the placement of labels along the quoted lines. It supports five controlling algorithms. See https://docs.generic-mapping-tools.org/6.6/grdcontour.html#g for details.
verbose (bool or str) – Select verbosity level [Full usage].
pen (str or list) – [type]pen[+c[l|f]]. type, if present, can be a for annotated contours or c for regular contours [Default]. The pen sets the attributes for the particular line. Default pen for annotated contours is
"0.75p,black"and for regular contours"0.25p,black". Normally, all contours are drawn with a fixed color determined by the pen setting. If +cl is appended the colors of the contour lines are taken from the CPT (seelevels). If +cf is appended the colors from the CPT file are applied to the contour annotations. Select +c for both effects.panel (
int|Sequence[int] |bool, default:False) –Select a specific subplot panel. Only allowed when used in
Figure.subplotmode.Trueto advance to the next panel in the selected order.index to specify the index of the desired panel.
(row, col) to specify the row and column of the desired panel.
The panel order is determined by the
Figure.subplotmethod. row, col and index all start at 0.coltypes (str) – [i|o]colinfo. Specify data types of input and/or output columns (time or geographical data). Full documentation is at https://docs.generic-mapping-tools.org/6.6/gmt.html#f-full.
label (str) – Add a legend entry for the contour being plotted. Normally, the annotated contour is selected for the legend. You can select the regular contour instead, or both of them, by considering the label to be of the format [annotcontlabel][/contlabel]. If either label contains a slash (/) character then use
|as the separator for the two labels instead.perspective (
float|Sequence[float] |str|bool, default:False) –Select perspective view and set the azimuth and elevation of the viewpoint.
Accepts a single value or a sequence of two or three values: azimuth, (azimuth, elevation), or (azimuth, elevation, zlevel).
azimuth: Azimuth angle of the viewpoint in degrees [Default is 180, i.e., looking from south to north].
elevation: Elevation angle of the viewpoint above the horizon [Default is 90, i.e., looking straight down at nadir].
zlevel: Z-level at which 2-D elements (e.g., the map frame) are drawn. Only applied when used together with
zsizeorzscale. [Default is at the bottom of the z-axis].
Alternatively, set
perspective=Trueto reuse the perspective setting from the previous plotting method, or pass a string following the full GMT syntax for finer control (e.g., adding+wor+vmodifiers to select an axis location other than the plot origin). See https://docs.generic-mapping-tools.org/6.6/gmt.html#perspective-full for details.transparency (float) – Set transparency level, in [0-100] percent range [Default is
0, i.e., opaque]. Only visible when PDF or raster format output is selected. Only the PNG format selection adds a transparency layer in the image (for further processing).
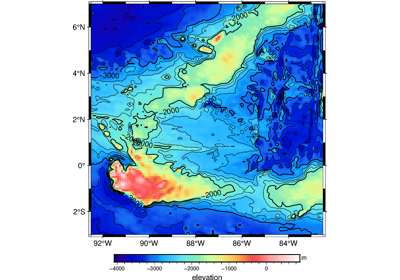
Example
>>> import pygmt
>>> # Load the 15 arc-minutes grid with "gridline" registration in the
>>> # specified region
>>> grid = pygmt.datasets.load_earth_relief(
...     resolution="15m",
...     region=[-92.5, -82.5, -3, 7],
...     registration="gridline",
... )
>>> # Create a new plot with pygmt.Figure()
>>> fig = pygmt.Figure()
>>> # Create the contour plot
>>> fig.grdcontour(
...     # Pass in the grid downloaded above
...     grid=grid,
...     # Set the interval for contour lines at 250 meters
...     levels=250,
...     # Set the interval for annotated contour lines at 1,000 meters
...     annotation=1000,
...     # Add a frame for the plot
...     frame="a",
...     # Set the projection to Mercator for the 10 cm figure
...     projection="M10c",
... )
>>> # Show the plot
>>> fig.show()